Support Contact: Anthony Klemm, NOAA Office of Coast Survey anthony.r.klemm@noaa.gov
A Windows operating system is currently required to use Pydro Explorer
Perform the following steps to process CSB data extracted from NCEI/DCDB to correct for tides and data-derived vessel transducer offset values: 1. You will need to download the **Pydro** software [here](https://svn.pydro.noaa.gov/Docs/html/Pydro/downloads.html) (supplemental downloads not required, just the base download). 2. Follow the [Data Extraction](https://cms-kb.marine.usf.edu/books/crowdsourced-bathymetry-manual-working-version/page/nceidcdb-data-extraction "NCEI/DCDB data extraction") instructions to retrieve the data you want to process. 3. When you receive the email link from NCEI, download the data and save it in an appropriate location. 4. Open **Pydro Explorer**, navigate to the ‘**BETA/EXPERIMENTAL**’ section of the Applications pane, and select ‘**CSB Processing.’** **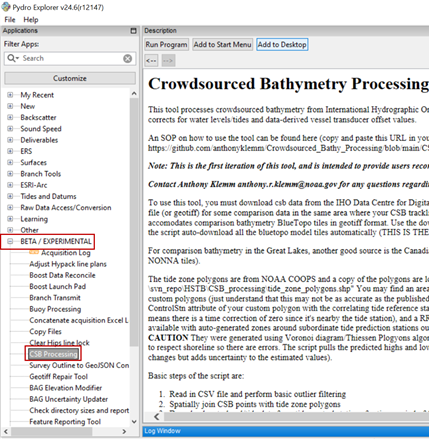** 5. Click '**Run Program**'. You’ll see a Windows terminal execute the python environment and a GUI should eventually pop up. 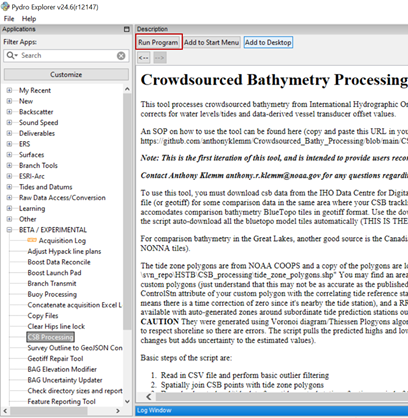If no GUI pops up, open the command line window to check if the following error was encountered: `ModuleNotFoundError: No module named 'pyfes' `
To resolve this error, enter the following line of code: `conda install -c conda-forge pyfes -y` 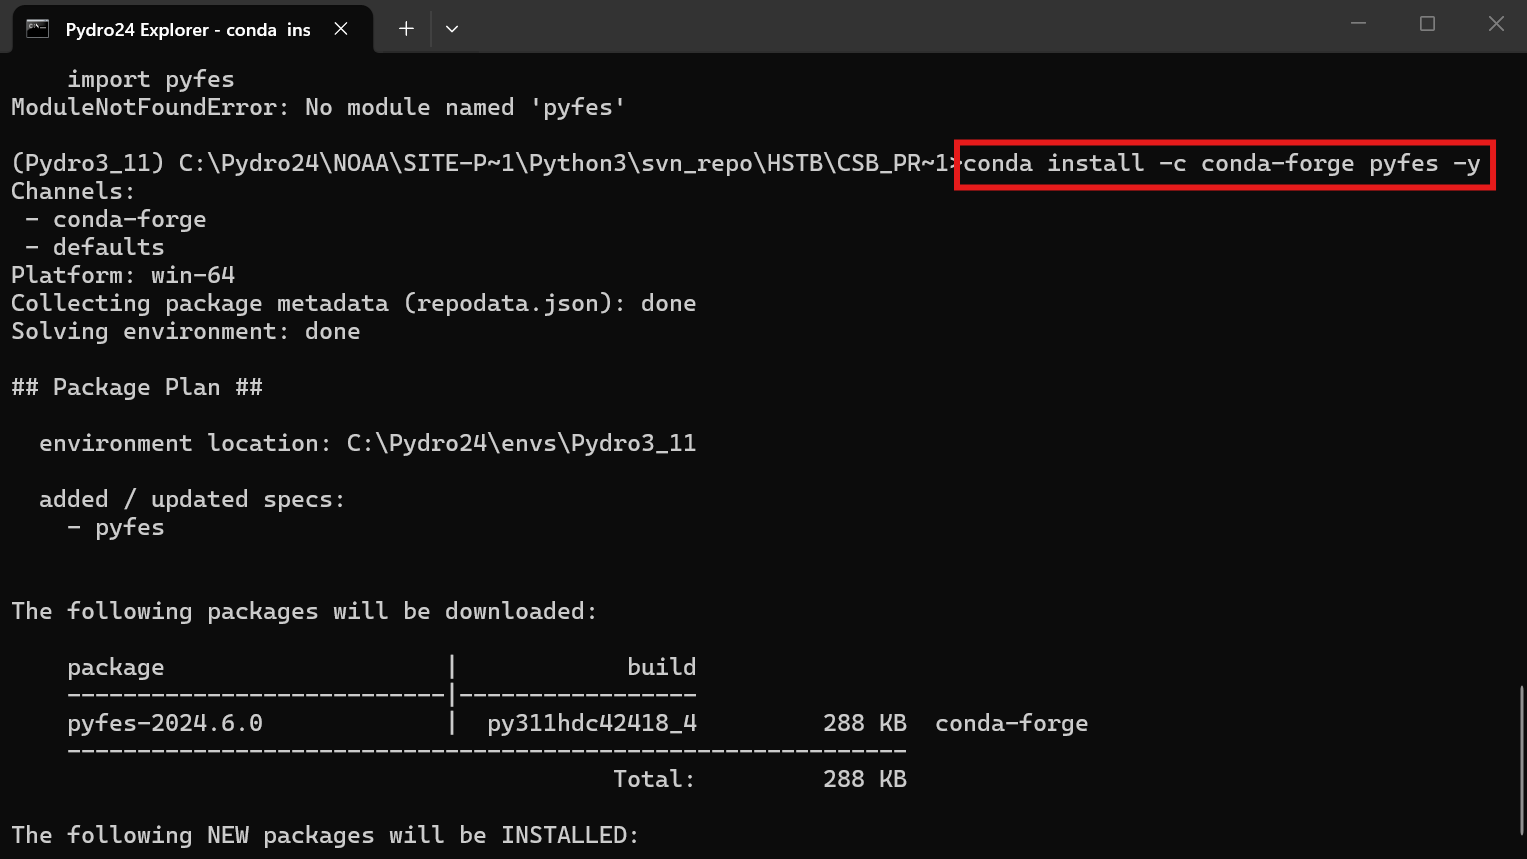 When the install is complete, close and re-open **Pydro Explorer,** navigate to the **CSB Processing** tool and click **Run Program** again. The GUI should pop up. 6. In the popup window: - **(1)** Locate and select the **Folder** containing the file you downloaded from NCEI; navigate to the Tide Zone file (see file path provided below); and specify an output folder. - - - **Note:** make sure the input **Folder** you select contains only the data you wish to process, the tool will process all CSV files located in the folder. - **(2)** Check the box to use automated BlueTopo data (unless a BAG/GeoTIFF of bathymetry covering the area of interest is available). - **(3)** Leave the default settings checked and set the desired grid resolution **(5-10 m)** for your workflow.For use outside the United States, the CSB Processing tool has an option to use a global tide model (AVISO+ FES2022b) to resolve/correct depths to approximate Lowest Astronomical Tide (approx LAT). Inside United States waters, it is recommended (but not required) to use the Discrete Tide Zoning model option instead.
**US Tide Zone .shp location:** C:\\Pydro24\\NOAA\\site-packages\\Python3\\svn\_repo\\HSTB\\CSB\_processing\\BETA\_subordinate\_tide\_zones\\tide\_zone\_polygons\_new\_WGS84\_merge.shp
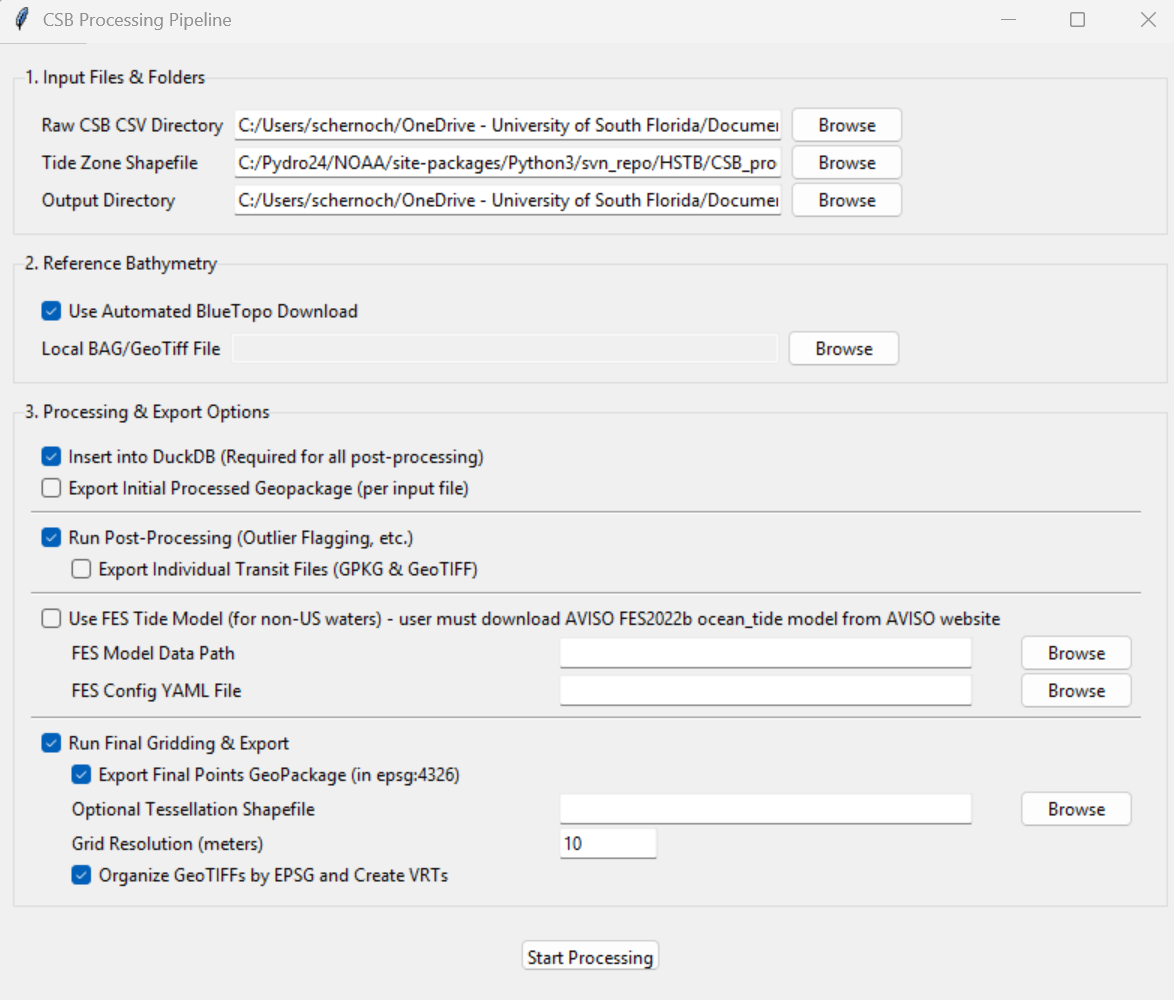 7. Click '**Start** **Processing**' and allow it to run. You can watch processing progress in the command line window. The application window will close when processing is complete. 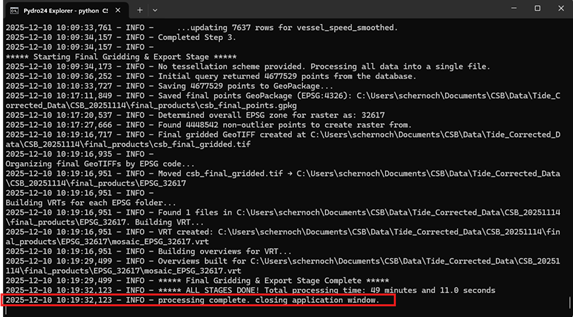Your CSB data are now tide corrected and have been output in a GeoPackage (.gpkg) that can be [visualized using GIS software](https://cms-kb.marine.usf.edu/books/crowdsourced-bathymetry-manual-working-version/chapter/data-visualization "Data Visualization").