# Data Visualization

<span>Tidal-corrected data should be edited using GIS software and uploaded to a central location which can be shared with your stakeholders. This allows you to provide data to participants in the format that best fits their needs. KML files are typically too large to easily manage. If a participant does not have a particular format in mind, suggest providing .shp files, which can be visualized in QGIS using the instructions provided on the </span>[QGIS: Data visualization](https://cms-kb.marine.usf.edu/books/crowdsourced-bathymetry-manual-working-version/page/qgis-data-visualization "QGIS: Data visualization")<span> page.</span>

# ArcGIS: Editing tide-corrected CSB data

For Trusted Nodes that have access to ESRI software licenses, tide-corrected CSB data can be edited and visualized using ArcGIS Pro.

<span style="mso-bidi-font-family: Aptos; mso-bidi-theme-font: minor-latin;"><span style="mso-list: Ignore;">1.<span style="font: 7.0pt 'Times New Roman';"> </span></span></span>Launch **ArcGIS Pro** and select **'Map'** under **New Project**. Create a name and select a location to save your project.

<span style="font-family: 'Calibri',sans-serif; color: #444444; border: none windowtext 1.0pt; mso-border-alt: none windowtext 0in; padding: 0in; mso-no-proof: yes;">![](https://cms-kb.marine.usf.edu/uploads/images/gallery/2026-01/embedded-image-5owat1gs.png)</span>

<span style="mso-bidi-font-family: Aptos; mso-bidi-theme-font: minor-latin;"><span style="mso-list: Ignore;">2.<span style="font: 7.0pt 'Times New Roman';"> </span></span></span>Under the **Insert** tab click '**Add Folder**' and select the folder where you set Pydro to output tide corrected data.

<span style="font-family: 'Calibri',sans-serif; color: #444444; border: none windowtext 1.0pt; mso-border-alt: none windowtext 0in; padding: 0in; mso-no-proof: yes;">![](https://cms-kb.marine.usf.edu/uploads/images/gallery/2026-01/embedded-image-sjthskmz.png)</span>

<span style="mso-bidi-font-family: Aptos; mso-bidi-theme-font: minor-latin;"><span style="mso-list: Ignore;">3.<span style="font: 7.0pt 'Times New Roman';"> </span></span></span>In the **Catalog** pane, click on the **Folders** dropdown, open the folder you just connected and locate the GeoPackage (**.gpkg**) that contains the tide corrected shapefile (**main.csb\_final\_points**). C*lick and drag* the **main.csb\_final\_points** file over the base map to add it as a map layer.

<span style="font-family: 'Calibri',sans-serif; color: #444444; border: none windowtext 1.0pt; mso-border-alt: none windowtext 0in; padding: 0in; mso-no-proof: yes;">![](https://cms-kb.marine.usf.edu/uploads/images/gallery/2026-01/embedded-image-gfdhtwzo.png)</span>

<span style="mso-bidi-font-family: Aptos; mso-bidi-theme-font: minor-latin;"><span style="mso-list: Ignore;">4.<span style="font: 7.0pt 'Times New Roman';"> </span></span></span>In the **Contents** pane, *right click* on the **main.csb\_final\_points** layer, click on the **Data** dropdown menu and select '**Export Features**.'

<span style="font-family: 'Calibri',sans-serif; color: #444444; border: none windowtext 1.0pt; mso-border-alt: none windowtext 0in; padding: 0in; mso-no-proof: yes;">![](https://cms-kb.marine.usf.edu/uploads/images/gallery/2026-01/embedded-image-0bthbraa.png)</span>

<span style="mso-bidi-font-family: Aptos; mso-bidi-theme-font: minor-latin;"><span style="mso-list: Ignore;">5.<span style="font: 7.0pt 'Times New Roman';"> </span></span></span>When the **Export Features** box appears, enter an appropriate name for the **Output Feature Class**, and click '**OK**'.

<span style="font-family: 'Calibri',sans-serif; color: #444444; border: none windowtext 1.0pt; mso-border-alt: none windowtext 0in; padding: 0in; mso-no-proof: yes;">![](https://cms-kb.marine.usf.edu/uploads/images/gallery/2026-01/embedded-image-phxk7foq.png)</span>

<span style="mso-bidi-font-family: Aptos; mso-bidi-theme-font: minor-latin;"><span style="mso-list: Ignore;">6.<span style="font: 7.0pt 'Times New Roman';"> </span></span></span>In the **Contents** pane, *right click* on the feature layer you just created and click on '**Attribute Table**.'

<span style="font-family: 'Calibri',sans-serif; color: #444444; border: none windowtext 1.0pt; mso-border-alt: none windowtext 0in; padding: 0in; mso-no-proof: yes;">![](https://cms-kb.marine.usf.edu/uploads/images/gallery/2026-01/embedded-image-lslxjqod.png)</span>

<span style="mso-bidi-font-family: Aptos; mso-bidi-theme-font: minor-latin;"><span style="mso-list: Ignore;">7.<span style="font: 7.0pt 'Times New Roman';"> </span></span></span>The attribute table should contain the following columns: **lat, lon, depth, time,** and **platform\_name**.

<span style="font-family: 'Calibri',sans-serif; color: #444444; border: none windowtext 1.0pt; mso-border-alt: none windowtext 0in; padding: 0in; mso-no-proof: yes;">![](https://cms-kb.marine.usf.edu/uploads/images/gallery/2026-01/embedded-image-cdgm2fa7.png)</span>

<p class="callout success"><span style="font-family: 'Calibri',sans-serif; color: #444444; border: none windowtext 1.0pt; mso-border-alt: none windowtext 0in; padding: 0in; mso-no-proof: yes;">You are now ready to [generate shapefiles of CSB data](https://cms-kb.marine.usf.edu/books/crowdsourced-bathymetry-manual-working-version/page/arcgis-generating-csb-data-shapefiles "ArcGIS: Generating CSB data shapefiles") to share with participants.</span></p>

# ArcGIS: Generating CSB data shapefiles

This section provides instructions on how to export shapefiles of CSB data for specific participants, or for upload to an ArcGIS Online CSB Data Portal.

If your shapefile contains data from multiple participants, you will need to apply a selection query to create individual layers for each participant's data.

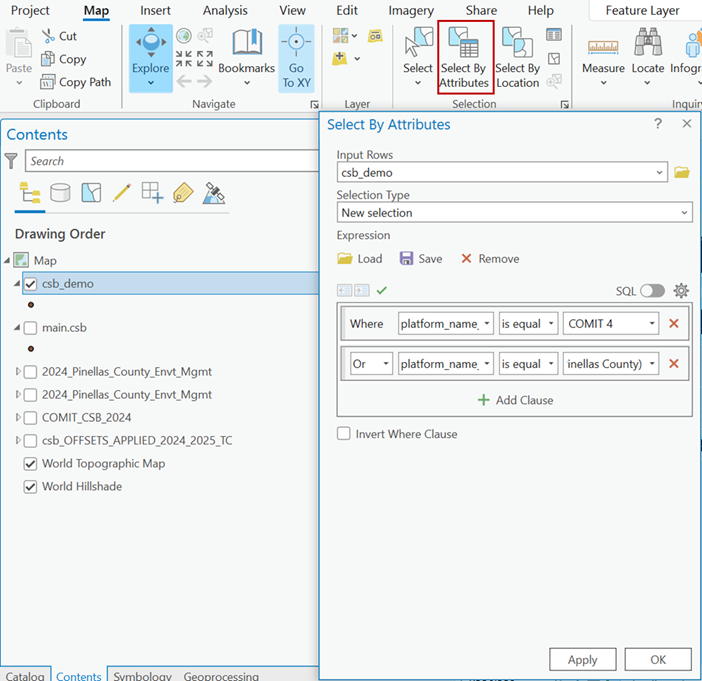
1. While the CSB map layer is selected, navigate to the **Selection** section under the **Map** tab and click on '**Select By Attributes**.' Set the **Selection Type** to *New selection* and set the clauses to: "**Where** *platform\_name* **is equal to** \[*participant name*\]." If a participant has data from more than one vessel, add additional clauses using the '**Or**' operator until all data for that participant are included in the selection. Click '**OK**' to apply your selection.   
    ![image.png](https://cms-kb.marine.usf.edu/uploads/images/gallery/2026-01/scaled-1680-/Uuaimage.png)
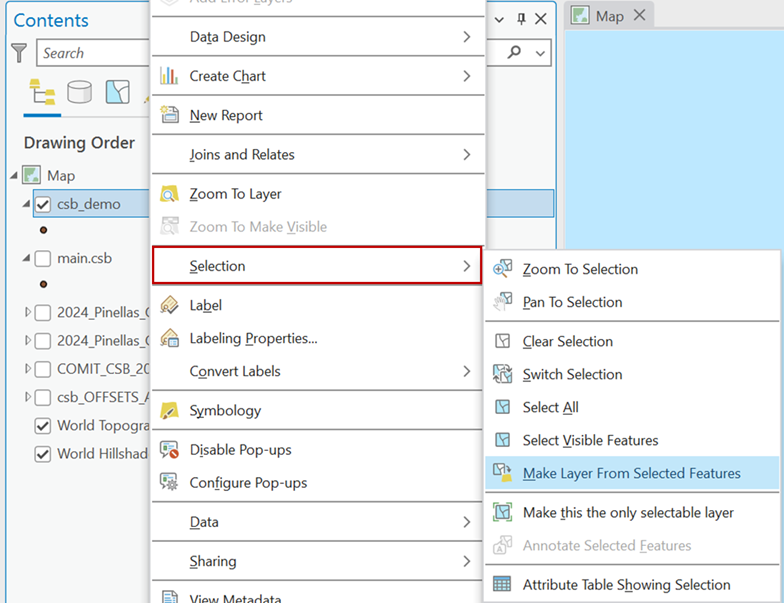
2. *Right click* on the CSB map layer and under the **Selection** dropdown choose '**Make Layer From Selected Features**.' Give the new layer an appropriate name to identify the participant and date range of the data.  
    ![image.png](https://cms-kb.marine.usf.edu/uploads/images/gallery/2026-01/scaled-1680-/Twlimage.png)
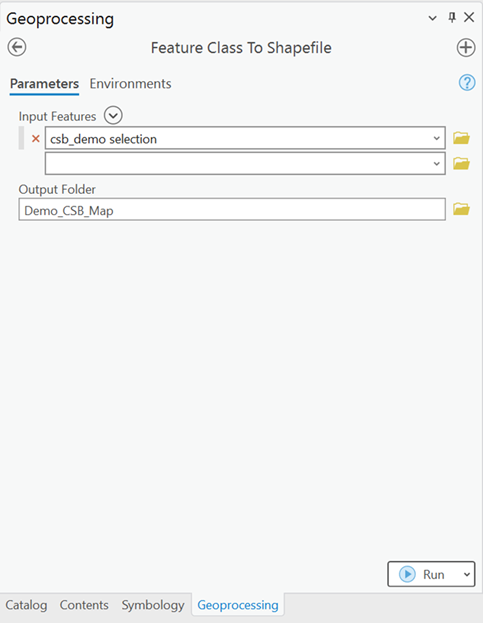
3. You will need to convert this new feature class layer into a shapefile that can be sent to the participant. In the **Geoprocessing** pane, search for the '**Feature Class to Shapefile**' tool. Add the layer you want to convert to *Input Features* and select an *Output Folder*. Click '**Run**.'  
    ![image.png](https://cms-kb.marine.usf.edu/uploads/images/gallery/2026-01/scaled-1680-/5hdimage.png)

<p class="callout success">You now have a shapefile of tide-corrected CSB data that can be zipped and sent to an individual participant or uploaded to an ArcGIS Online portal. </p>

# QGIS: Editing tide-corrected CSB data

<span style="font-size: 10.0pt; line-height: 115%;">For Trusted Nodes that prefer to use free and open-source GIS software, the following section describes how to edit tide-corrected CSB data using QGIS, and how to export shapefiles of data that can be shared with program participants.</span>

1. <span style="font-size: 10.0pt; line-height: 115%;"><span style="font-size: 10.0pt; line-height: 115%; font-family: 'Aptos',sans-serif; mso-ascii-theme-font: minor-latin; mso-fareast-font-family: Aptos; mso-fareast-theme-font: minor-latin; mso-hansi-theme-font: minor-latin; mso-bidi-font-family: 'Times New Roman'; mso-bidi-theme-font: minor-bidi; mso-ansi-language: EN-US; mso-fareast-language: EN-US; mso-bidi-language: AR-SA;">Launch QGIS and select **New** under the **Project** tab to create a new project.  
    </span></span>![image.png](https://cms-kb.marine.usf.edu/uploads/images/gallery/2026-01/scaled-1680-/y3oimage.png)
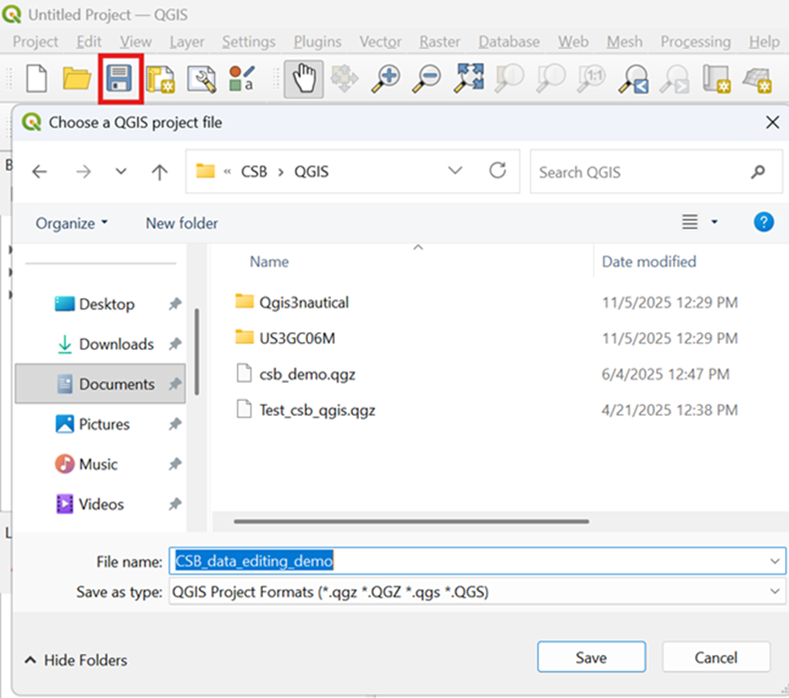
2. <span style="font-size: 10.0pt; line-height: 115%;"><span style="font-size: 10.0pt; line-height: 115%; font-family: 'Aptos',sans-serif; mso-ascii-theme-font: minor-latin; mso-fareast-font-family: Aptos; mso-fareast-theme-font: minor-latin; mso-hansi-theme-font: minor-latin; mso-bidi-font-family: 'Times New Roman'; mso-bidi-theme-font: minor-bidi; mso-ansi-language: EN-US; mso-fareast-language: EN-US; mso-bidi-language: AR-SA;">Click the *Save* icon to name the project and save it in an appropriate location.  
    </span></span>![image.png](https://cms-kb.marine.usf.edu/uploads/images/gallery/2026-01/scaled-1680-/tH5image.png)
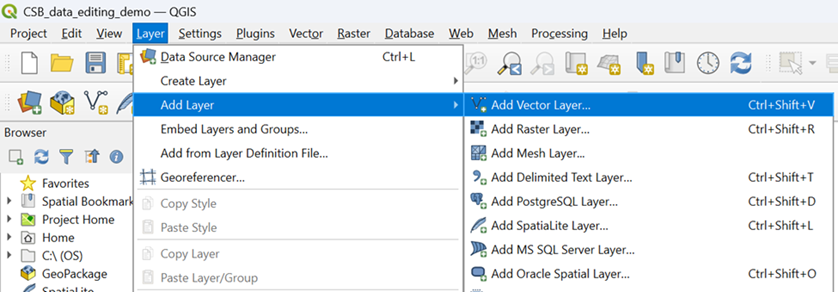
3. <span style="font-size: 10.0pt; line-height: 115%;"><span style="font-size: 10.0pt; line-height: 115%; font-family: 'Aptos',sans-serif; mso-ascii-theme-font: minor-latin; mso-fareast-font-family: Aptos; mso-fareast-theme-font: minor-latin; mso-hansi-theme-font: minor-latin; mso-bidi-font-family: 'Times New Roman'; mso-bidi-theme-font: minor-bidi; mso-ansi-language: EN-US; mso-fareast-language: EN-US; mso-bidi-language: AR-SA;">Under the **Layer** tab, click on **Add Layer** and select **Add Vector Layer** from the drop-down menu.  
    </span></span>![image.png](https://cms-kb.marine.usf.edu/uploads/images/gallery/2026-01/scaled-1680-/pjkimage.png)
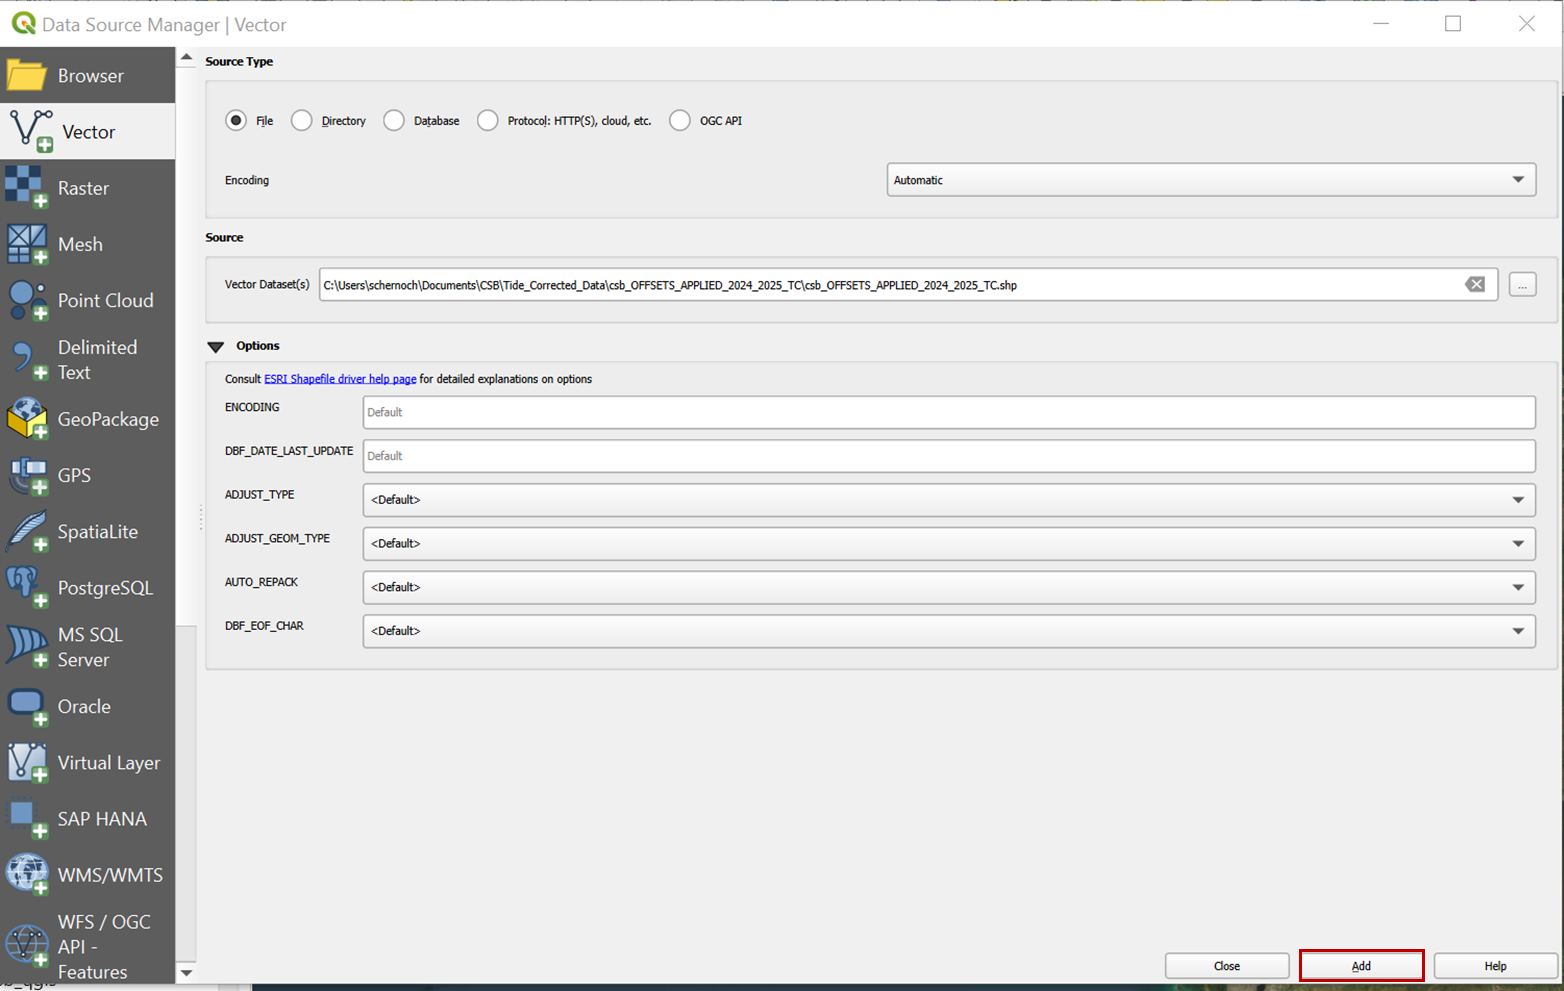
4. In <span style="font-size: 10.0pt; line-height: 115%; font-family: 'Aptos',sans-serif; mso-ascii-theme-font: minor-latin; mso-fareast-font-family: Aptos; mso-fareast-theme-font: minor-latin; mso-hansi-theme-font: minor-latin; mso-bidi-font-family: 'Times New Roman'; mso-bidi-theme-font: minor-bidi; mso-ansi-language: EN-US; mso-fareast-language: EN-US; mso-bidi-language: AR-SA;">the **Source / Vector Dataset** box, navigate to the .gpkg of tide-corrected data that was output by Pydro. Click **Add** to import the data to the project.  
    </span>![image.png](https://cms-kb.marine.usf.edu/uploads/images/gallery/2026-01/scaled-1680-/KR1image.png)
5. *<span style="font-size: 10.0pt; line-height: 115%; font-family: 'Aptos',sans-serif; mso-ascii-theme-font: minor-latin; mso-fareast-font-family: Aptos; mso-fareast-theme-font: minor-latin; mso-hansi-theme-font: minor-latin; mso-bidi-font-family: 'Times New Roman'; mso-bidi-theme-font: minor-bidi; mso-ansi-language: EN-US; mso-fareast-language: EN-US; mso-bidi-language: AR-SA;">Right click </span>*<span style="font-size: 10.0pt; line-height: 115%; font-family: 'Aptos',sans-serif; mso-ascii-theme-font: minor-latin; mso-fareast-font-family: Aptos; mso-fareast-theme-font: minor-latin; mso-hansi-theme-font: minor-latin; mso-bidi-font-family: 'Times New Roman'; mso-bidi-theme-font: minor-bidi; mso-ansi-language: EN-US; mso-fareast-language: EN-US; mso-bidi-language: AR-SA;">on the vector layer and select **Open Attribute Table**.  
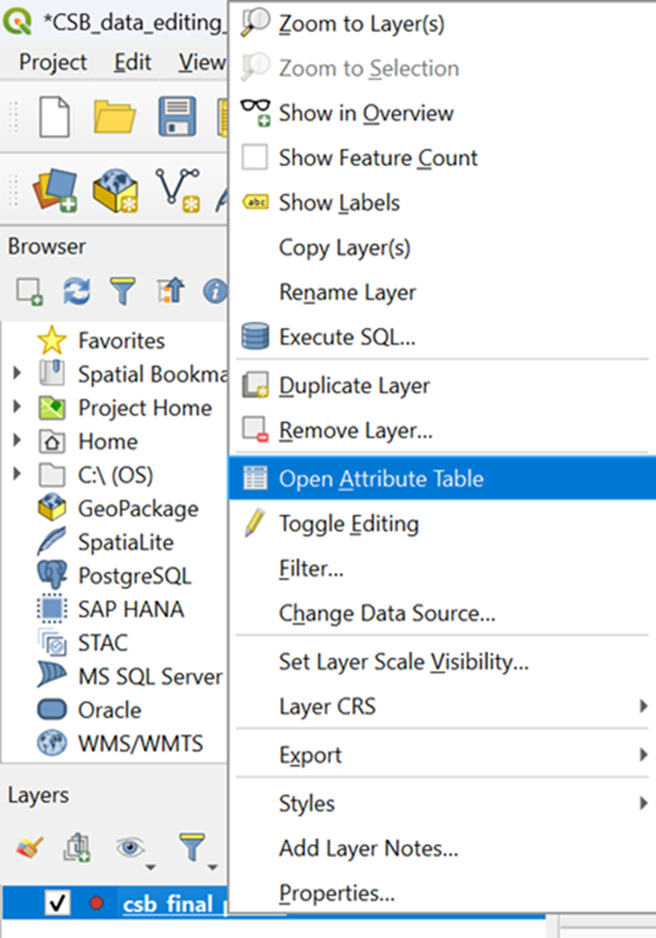
    </span>![image.png](https://cms-kb.marine.usf.edu/uploads/images/gallery/2026-01/scaled-1680-/5UZimage.png)
6. <span style="font-size: 10.0pt; line-height: 115%; font-family: 'Aptos',sans-serif; mso-ascii-theme-font: minor-latin; mso-fareast-font-family: Aptos; mso-fareast-theme-font: minor-latin; mso-hansi-theme-font: minor-latin; mso-bidi-font-family: 'Times New Roman'; mso-bidi-theme-font: minor-bidi; mso-ansi-language: EN-US; mso-fareast-language: EN-US; mso-bidi-language: AR-SA;">The table should contain the columns**: lat, lon, time, depth,** and **platform\_name.** </span>![image.png](https://cms-kb.marine.usf.edu/uploads/images/gallery/2026-01/scaled-1680-/fEWimage.png)

    
    ***<span style="font-size: 10.0pt; line-height: 115%;">If your shapefile contains data from multiple participants, you will need to apply a selection query to create individual layers for each participant's data.</span>***
7. <span style="font-size: 10.0pt; line-height: 115%; font-family: 'Aptos',sans-serif; mso-ascii-theme-font: minor-latin; mso-fareast-font-family: Aptos; mso-fareast-theme-font: minor-latin; mso-hansi-theme-font: minor-latin; mso-bidi-font-family: 'Times New Roman'; mso-bidi-theme-font: minor-bidi; mso-ansi-language: EN-US; mso-fareast-language: EN-US; mso-bidi-language: AR-SA;">Select the CSB vector layer and click on the **Select Features by Value** icon. To select all data points from an individual participant, enter an appropriate term into the *platform\_name* box, and set the filter to *Contains*. Click on **Select Features** to apply the selection.  
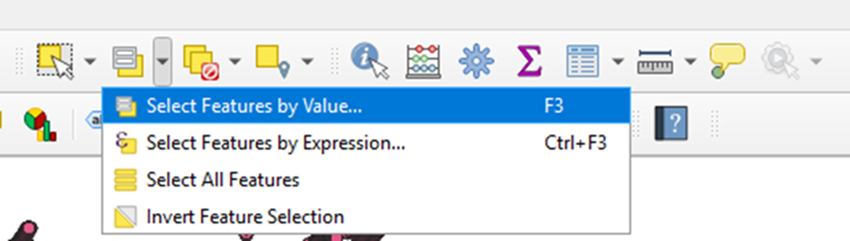
    </span>![image.png](https://cms-kb.marine.usf.edu/uploads/images/gallery/2026-01/scaled-1680-/YHFimage.png)
    
    ![image.png](https://cms-kb.marine.usf.edu/uploads/images/gallery/2026-01/scaled-1680-/6pCimage.png)
8. <span style="font-size: 10.0pt; line-height: 115%; font-family: 'Aptos',sans-serif; mso-ascii-theme-font: minor-latin; mso-fareast-font-family: Aptos; mso-fareast-theme-font: minor-latin; mso-hansi-theme-font: minor-latin; mso-bidi-font-family: 'Times New Roman'; mso-bidi-theme-font: minor-bidi; mso-ansi-language: EN-US; mso-fareast-language: EN-US; mso-bidi-language: AR-SA;">A banner at the bottom left of the window should read out how many points were included in the selection.  
    </span>![image.png](https://cms-kb.marine.usf.edu/uploads/images/gallery/2026-01/scaled-1680-/Zzbimage.png)
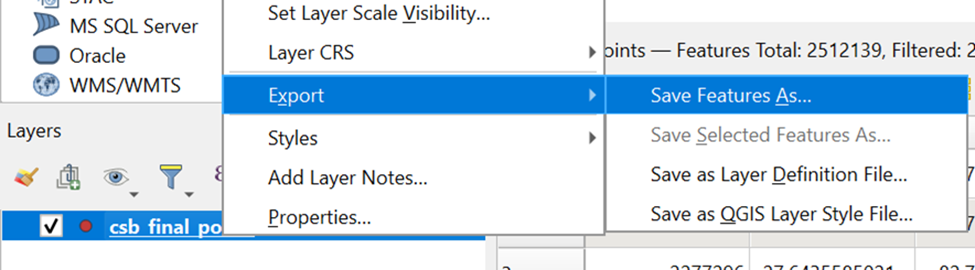
9. <span style="font-size: 10.0pt; line-height: 115%; font-family: 'Aptos',sans-serif; mso-ascii-theme-font: minor-latin; mso-fareast-font-family: Aptos; mso-fareast-theme-font: minor-latin; mso-hansi-theme-font: minor-latin; mso-bidi-font-family: 'Times New Roman'; mso-bidi-theme-font: minor-bidi; mso-ansi-language: EN-US; mso-fareast-language: EN-US; mso-bidi-language: AR-SA;">*Right click* on the vector layer and under the **Export** drop-down menu, select **Save Feature As**</span><span style="font-size: 10.0pt; line-height: 115%; font-family: 'Aptos',sans-serif; mso-ascii-theme-font: minor-latin; mso-fareast-font-family: Aptos; mso-fareast-theme-font: minor-latin; mso-hansi-theme-font: minor-latin; mso-bidi-font-family: 'Times New Roman'; mso-bidi-theme-font: minor-bidi; mso-ansi-language: EN-US; mso-fareast-language: EN-US; mso-bidi-language: AR-SA;">.  
    </span>![image.png](https://cms-kb.marine.usf.edu/uploads/images/gallery/2026-01/scaled-1680-/DaCimage.png)
10. <span style="font-size: 10.0pt; line-height: 115%; font-family: 'Aptos',sans-serif; mso-ascii-theme-font: minor-latin; mso-fareast-font-family: Aptos; mso-fareast-theme-font: minor-latin; mso-hansi-theme-font: minor-latin; mso-bidi-font-family: 'Times New Roman'; mso-bidi-theme-font: minor-bidi; mso-ansi-language: EN-US; mso-fareast-language: EN-US; mso-bidi-language: AR-SA;">Select *ESRI Shapefile* as the **Format** and add an appropriate file name and location. Make sure to check the box to *Save only selected features.* Click **OK** to save.  
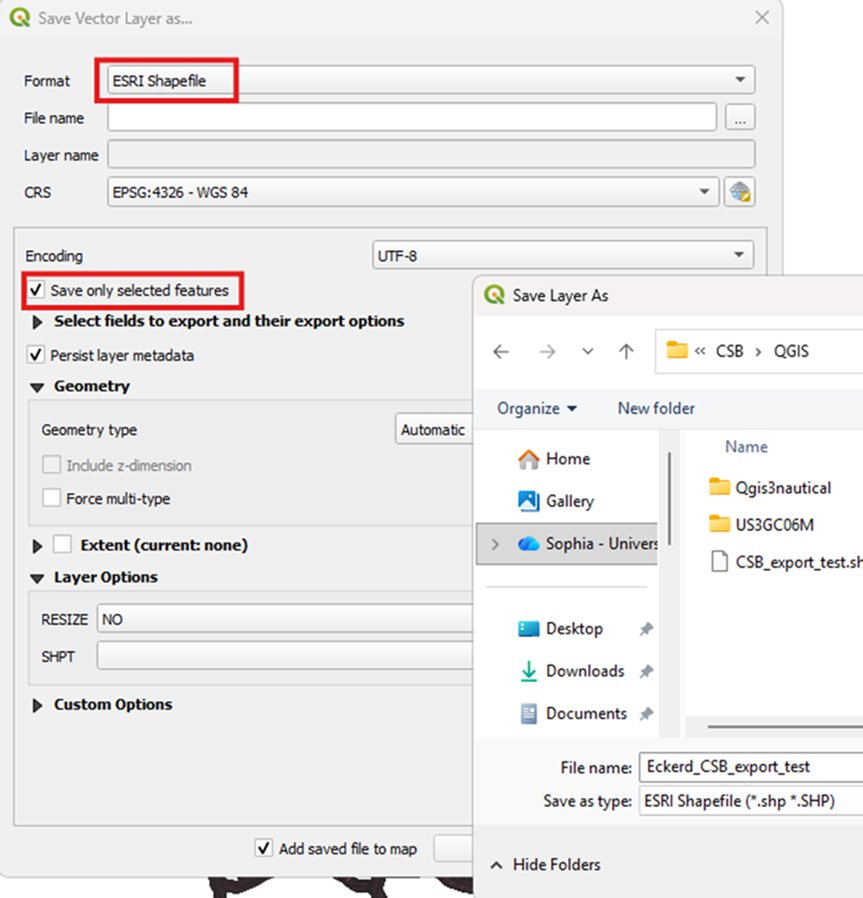
    </span>![image.png](https://cms-kb.marine.usf.edu/uploads/images/gallery/2026-01/scaled-1680-/WA4image.png)

<p class="callout success"><span style="font-size: 10.0pt; line-height: 115%;">You now have a shapefile of tide-corrected CSB data that can be zipped and sent to an individual participant.</span></p>

# QGIS: Data visualization

##### <span style="text-decoration: underline;">Motivation</span>

Some crowdsourced bathymetry participants may have a clear idea of how they intend to use the depth soundings they've collected and what data format best suits that purpose. Others may benefit from a simple tutorial on how to visualize their data using a free, open-source software ([QGIS](https://qgis.org/project/overview/)).

This will allow the Trusted Node to return data to participants in the .shp file format and ensure that participants can easily visualize their contributions to the program. This option may be particularly valuable to newly established Trusted Nodes that have not yet constructed an ArcGIS Hub site (e.g., [Crowd the Bay](https://crowdthebay-usfmarsci.hub.arcgis.com/)) or similar platform for public CSB data access.

##### <span style="text-decoration: underline;">Tutorial</span>

1. You will first need to [download QGIS](https://qgis.org/download/). (If needed, installation instructions are available [here](https://qgis.org/resources/installation-guide/)).
2. Launch QGIS. Click on the **Project** tab and select '**New**' to open a blank map. Make sure to save your project with an appropriate name.  
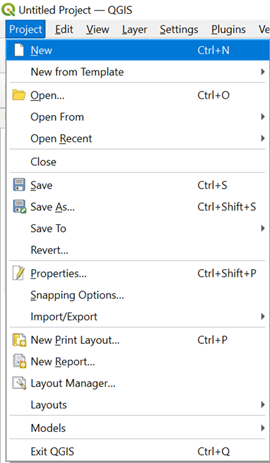
    ![image.png](https://cms-kb.marine.usf.edu/uploads/images/gallery/2026-01/scaled-1680-/I8iimage.png)
3. Click on the **Plugins** tab and select '**Manage and Install Plugins**.'  

    ![image.png](https://cms-kb.marine.usf.edu/uploads/images/gallery/2026-01/scaled-1680-/KE9image.png)
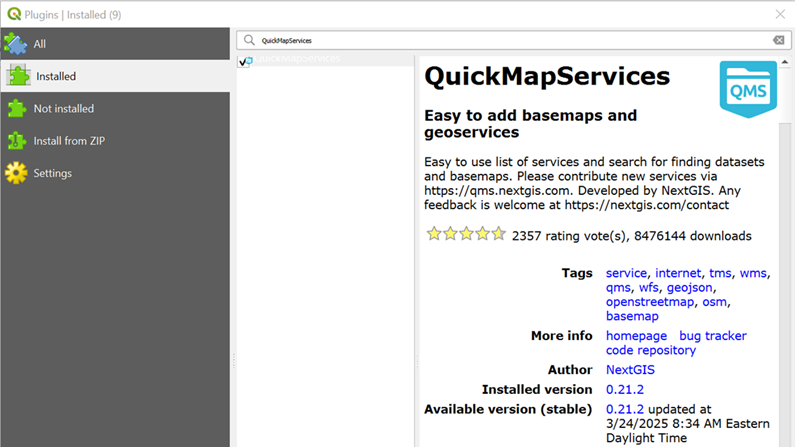
4. Search for and install the **QuickMapServices** plugin.  
    ![image.png](https://cms-kb.marine.usf.edu/uploads/images/gallery/2026-01/scaled-1680-/9I9image.png)
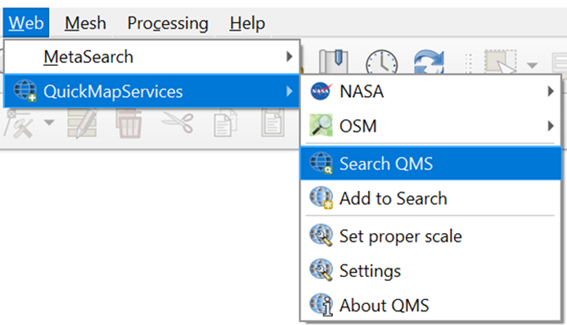
5. Under the **Web** tab, select **QuickMapServices** and click on '**Search QMS**.'  
    ![image.png](https://cms-kb.marine.usf.edu/uploads/images/gallery/2026-01/scaled-1680-/6W0image.png)
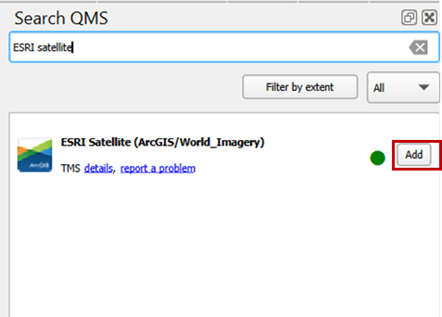
6. Search for **ESRI Satellite (ArcGIS/World\_Imagery)** and click '**Add**.'  
    ![image.png](https://cms-kb.marine.usf.edu/uploads/images/gallery/2026-01/scaled-1680-/lcrimage.png)
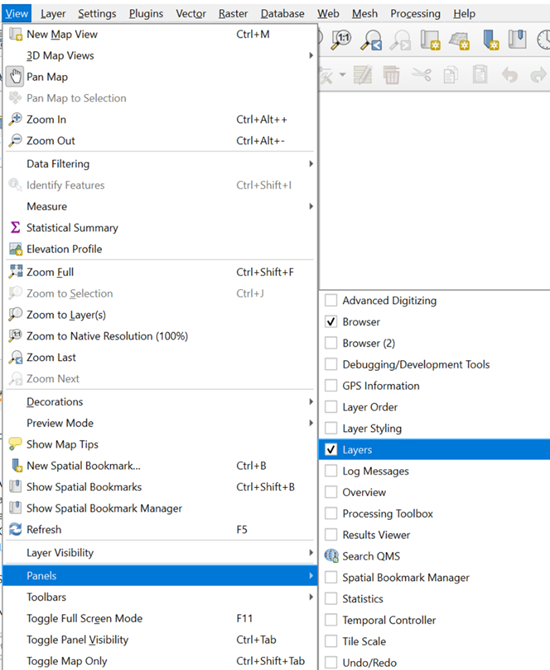
7. Under the **View** tab, click **Panels** and turn on the '**Layers**' option.  
    ![image.png](https://cms-kb.marine.usf.edu/uploads/images/gallery/2026-01/scaled-1680-/U2jimage.png)
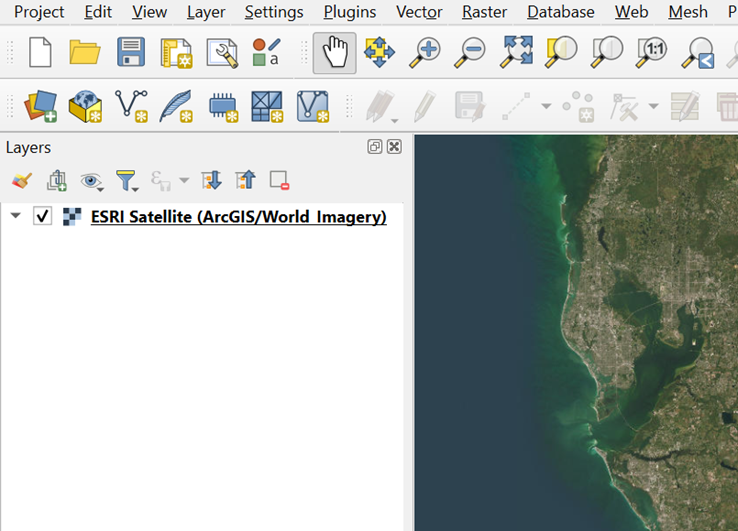
8. In the **Layers** panel, check the box for **ESRI Satellite (ArcGIS/World\_Imagery)** to turn it on.  
    ![image.png](https://cms-kb.marine.usf.edu/uploads/images/gallery/2026-01/scaled-1680-/JKFimage.png)
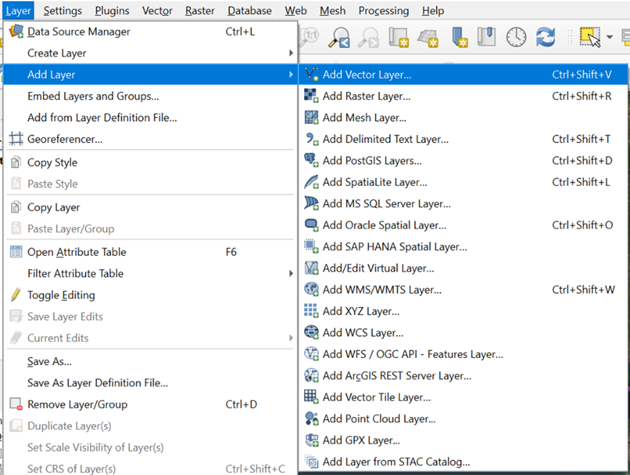
9. Under the **Layer** tab, click **Add Laye**r and select '**Add Vector Layer**.'  
    ![image.png](https://cms-kb.marine.usf.edu/uploads/images/gallery/2026-01/scaled-1680-/cazimage.png)
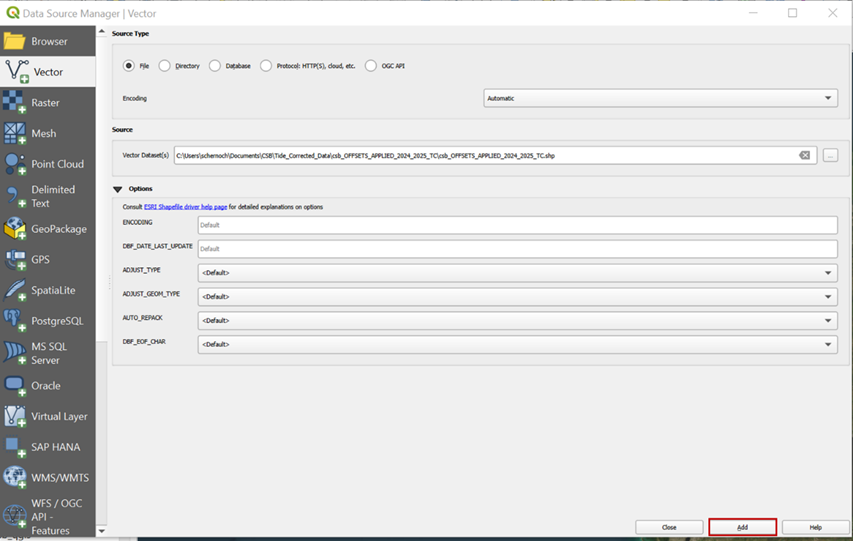
10. In the **Source** box, enter the path to the tide-corrected CSB .shp file you wish to visualize, and click '**Add**.'  
    ![image.png](https://cms-kb.marine.usf.edu/uploads/images/gallery/2026-01/scaled-1680-/bg3image.png)
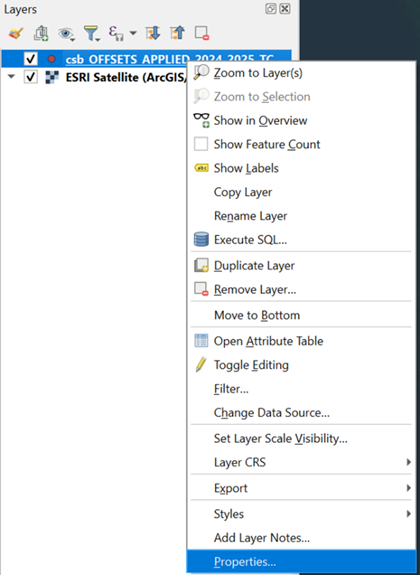
11. In the **Layers** panel, right click on the layer you just added, and select '**Properties**.'  
    ![image.png](https://cms-kb.marine.usf.edu/uploads/images/gallery/2026-01/scaled-1680-/ofyimage.png)
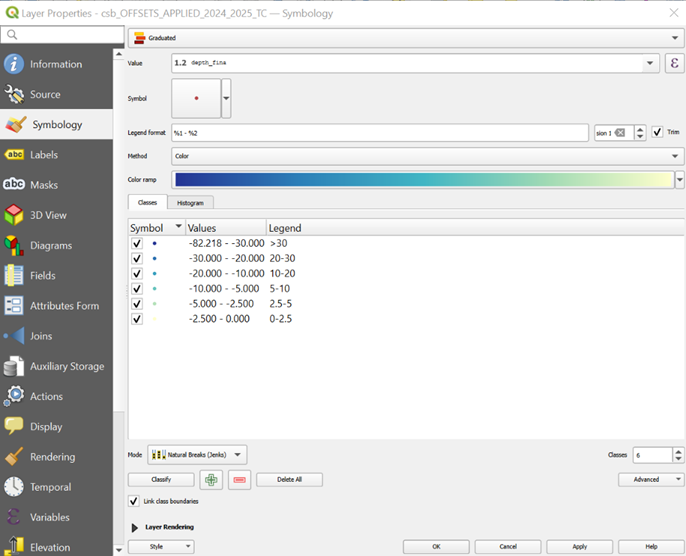
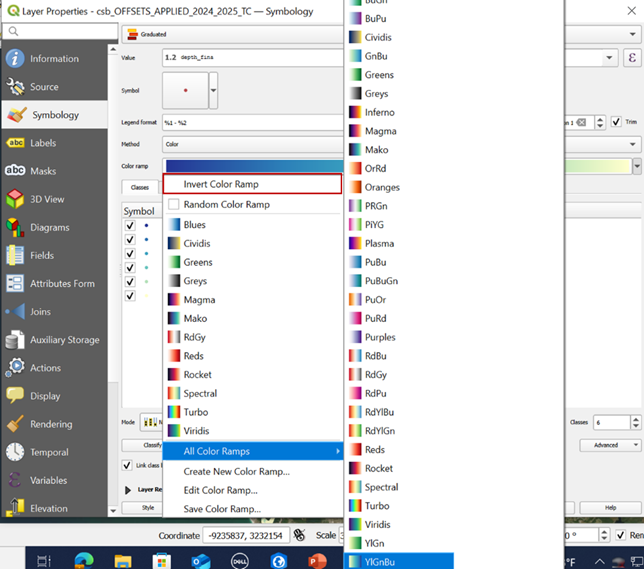
12. In the **Symbology** window, set the symbol type to *Graduated*, **Value** to *depth*, **Color ramp** to *YlGnBu* (and inverted), and set the classification **Mode**, **Values**, and **Legend** to best suit the range and distribution of your dataset. Click '**Apply**' to confirm changes.  
    ![image.png](https://cms-kb.marine.usf.edu/uploads/images/gallery/2026-01/scaled-1680-/wPCimage.png)
    
    ![image.png](https://cms-kb.marine.usf.edu/uploads/images/gallery/2026-01/scaled-1680-/zjZimage.png)
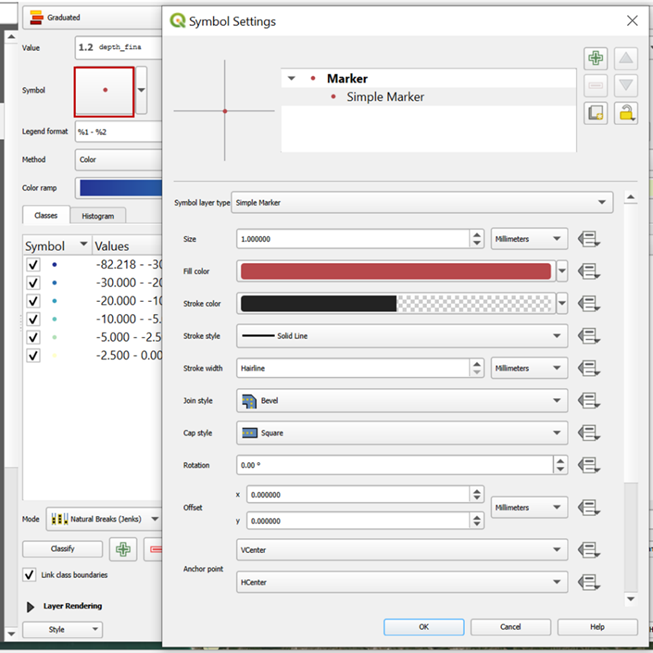
13. Click on the **Symbol** icon to adjust symbol settings. Set the **Size** to *1* and the **Stroke color** to *transparent*. Click '**OK**' to apply changes.  
    ![image.png](https://cms-kb.marine.usf.edu/uploads/images/gallery/2026-01/scaled-1680-/Fb8image.png)

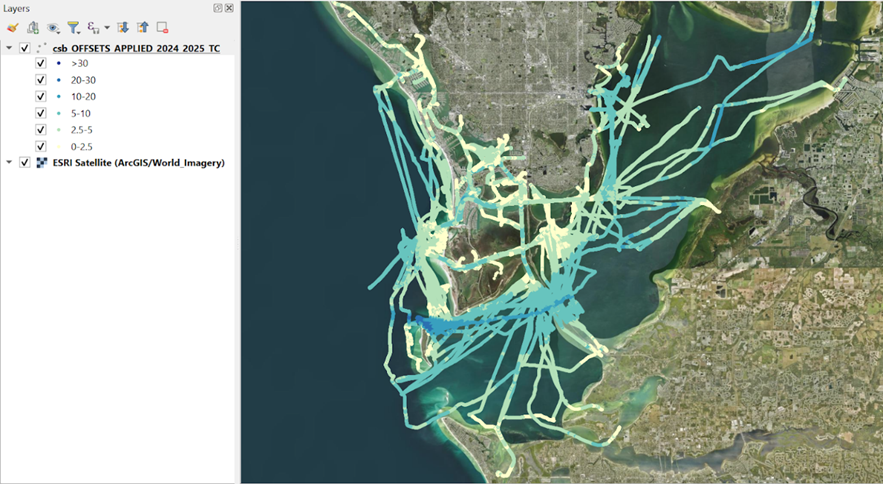
<p class="callout success">You should now have a well-symbolized, tide-corrected CSB data layer to work with.</p>

![image.png](https://cms-kb.marine.usf.edu/uploads/images/gallery/2026-01/scaled-1680-/jC9image.png)

If you're feeling tech-savvy and interested in overlaying CSB data onto a NOAA Electronic Navigational Chart for comparison, you can locate and download the appropriate charts[ here](https://charts.noaa.gov/InteractiveCatalog/nrnc.shtml?rnc=12402) and follow[ these instructions](https://www.sigterritoires.fr/index.php/en/displaying-s57-nautical-charts-in-qgis-3-x/) to display them in QGIS.